In the past I have written posts about the different types of reports available in the merchant interface of a few affiliate networks, but today I would like to talk about a report in ShareASale that is extremely important in many ways. ShareASale offers a dynamic interface that allows merchants to access a plethora of information to help (or continue) to grow their affiliate program, but the one report that I eluded to above the “Year in Review” report.
The “Year in Review” report is good to use for checking MoM and YoY trends, analyzing what challenges were experienced in a given month, successes, and it can also be helpful for testing different strategies. It is also good to use instead of the “Affiliate Timespan” reports. For example, if a merchant wants to test different landing pages to improve conversion rate in June, they can review the data in the “Year in Review” report in July and compare it to May and make any necessary changes the following month. Want to know how to access this vital report and understands its contents? Of course you do. I will outline the step-by-step process to go through to get you hands on this report.
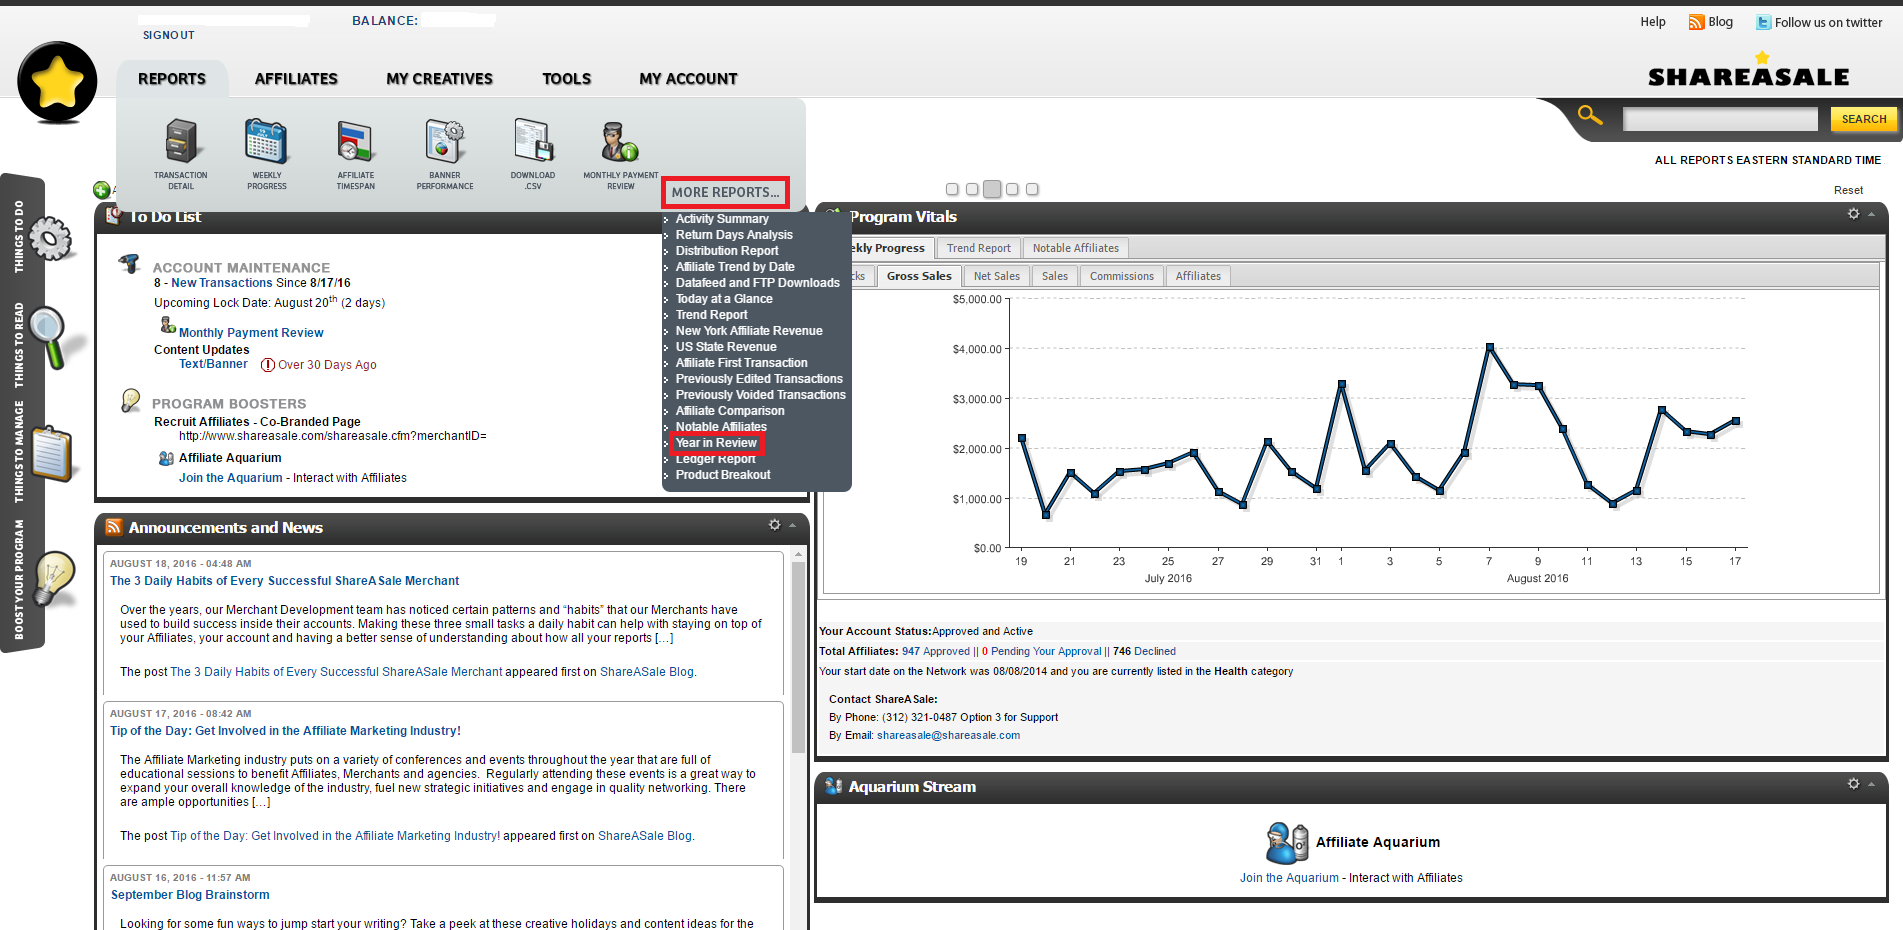
Step # 1 – Navigate to the “Year in Review” Report
Once logged into the merchant ShareASale interface you will navigate to “Reports”, then “More Reports”, then finally “Year in Review”.
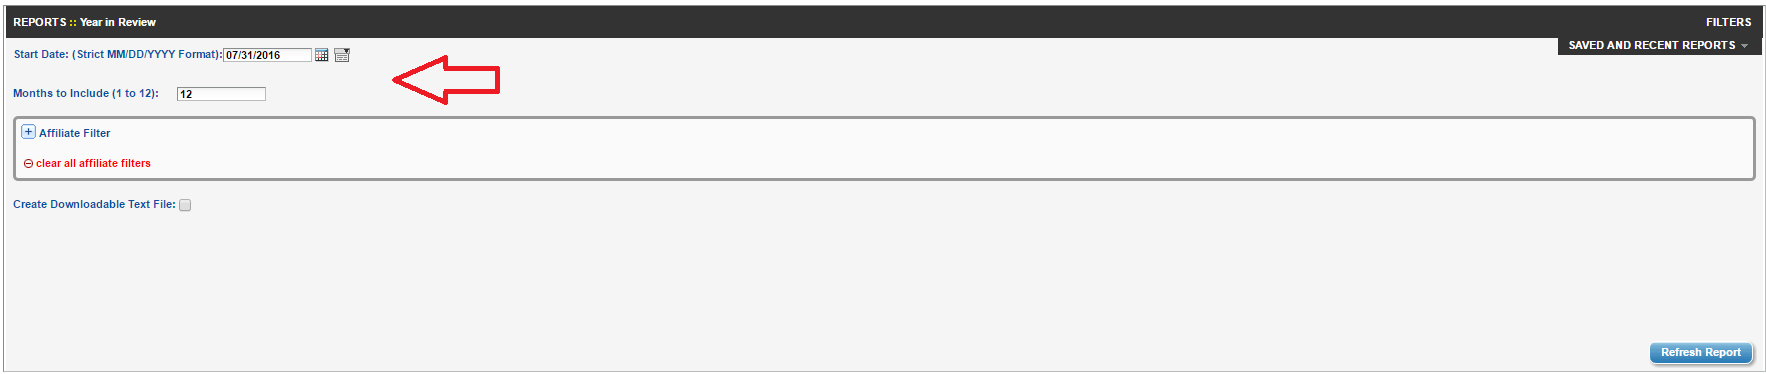
Step # 2 – Setting Parameters for Report
This part is the most important. You want to make sure you pull the data you want to analyze in detail. First, select the start date (if you want 2016 data to date input 7/31/2016). Next, you have the option to include all 12 months or a select few. With this you can also include/exclude specific affiliates by using the affiliate filter option (if you want ALL data, just keep it as is). Once the parameters have been set, hit “Refresh Report”. This will then pull up all the data requested and can now be reviewed.
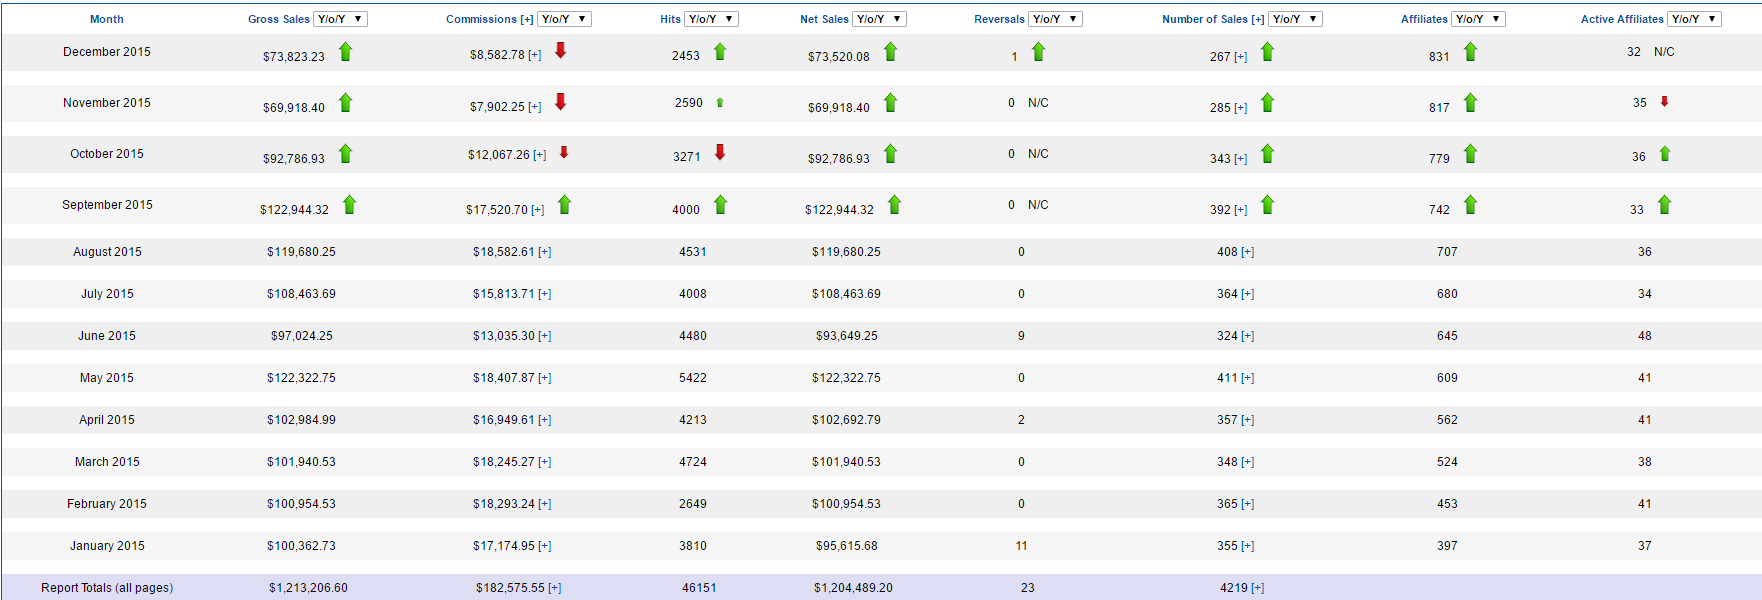
Step # 3 – Reviewing Data
This is the fun part. The amount of data returned is perfect for making business decisions. Provided is gross sales, commissions (excluding SaS fees), hits (clicks), net sales, reversals, number of sales, affiliates in the program, and active affiliates. There is an option to see year-over-year or month-over-month data for all the data lines. Review the trends and strategize for the future, this is why this report is valuable to any affiliate manager.
Does your affiliate program want more active affiliates? Simply analyze the active affiliates column and craft a strategy to engage more affiliates and roll it out via newsletters and/or a blog post. That is just one example of what can be done with this report.
It is a fact that numbers drive decisions and strategies, so now affiliate managers and other marketing team members have access to quality data that can aid in growth and prosperity.